
Recently we started a new open-climate-investing project to make climate investing actionable. We worked on a model that could calculate a company’s climate risk exposure based on its returns relative to high climate risk (Brown) and low climate risk (Green) stocks. You could then use this model to assess the climate risk exposure of a company based on its stock prices, or look for mispricings and opportunities by comparing the market’s estimate of climate risk exposure to fundamental research.
The key to this model is identifying the correct high and low climate risk stocks. This doesn’t sound like it should be so hard. If ESG metrics are useful for climate investing at all, then they should at least be able to tell us who the best and worst performers are.
So we tested several different ways to identify the high and low climate risk stocks, using both research and actual Exchange Traded Funds (ETF’s) that incorporated ESG metrics. We built multi-factor returns models using these different ESG metrics and compared the climate risk exposures they calculated. The full results are in this research paper, but you probably just want to know “Did it work?” And the short answer is:
Yes and No.
The good news is that we were able to build a very simple and elegant climate risk model from the return difference of just two ETF’s, the SPDR Series Trust – SPDR S&P Oil & Gas Exploration & Production ETF (XOP) as Brown stocks and the VanEck Vectors Low Carbon Energy ETF (SMOG) as the Green stocks. We orthogonalized this return difference against bond market factors and credit spreads, which is a fancy way of saying we removed the effect of changes in interest rates, the shape of the yield curve, and the relative interest rates paid by higher credit risk borrowers. The resulting model was able to identify the climate risk profile of both oil companies and renewable energy stocks quite successfully:
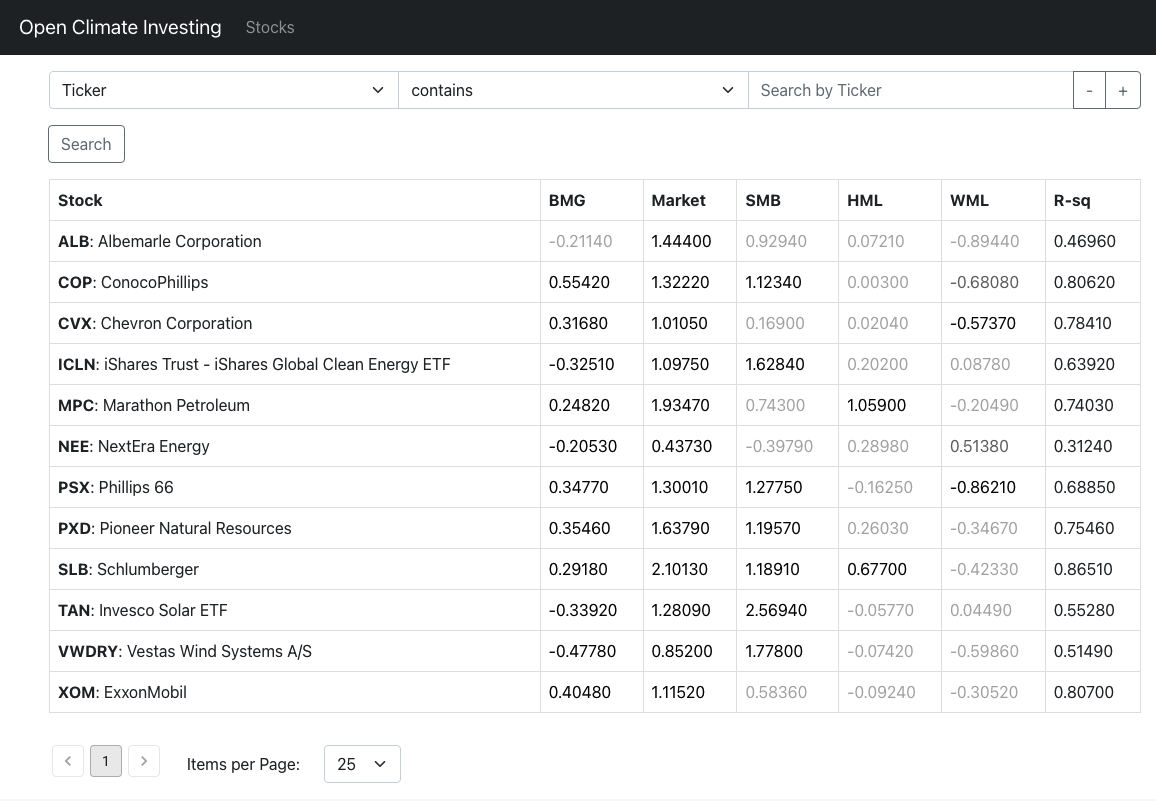
This screenshot shows the risk exposures of several oil companies and renewable energy stocks. Look in the column labeled “BMG”, short for “Brown Minus Green.” It is the ratio of the stock’s return relative to the return difference between Brown (high climate risk) and Green (low climate risk) stocks. If it is positive, it means that the stock will (on average) outperform when Brown stocks with high climate risk outperform. If it is negative, it means that the stock will (on average) outperform when Green stocks with low climate risk outperform. If the number is greyed out, like for Albemarle, then the ratio is not statistically significant.
As you can see, the oil companies have positive BMG climate exposure, and the renewable stocks have negative BMG climate exposure.
This is good news. It means, first, that adding renewable energy stocks could offset the climate risks in oil companies for your portfolio. (Though that has its own risks — see the analysis in structuring portfolios.) Second, it is possible to create an easily tradeable indicator of climate risk profile– great news for fund managers, risk analysts, and quants in general. Finally, it means that the financials markets really are starting to price in the climate risk exposure.
Once we have this measure of climate risk for stocks, we could do a lot of fun things like compare investments with each other. For example, we found that generally, the renewable stocks with negative climate exposures had much higher Price/Book ratios than the oil stocks with positive climate exposures:
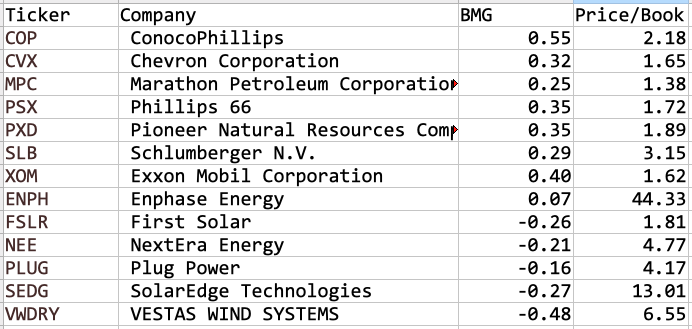
This means that the stock market is already rewarding the renewable companies with higher valuations, probably the best argument for a company’s Board to reduce climate risk exposures. In of itself, it’s probably not a new observation. But the potential new observation is that we now also have a way to see if the market is correctly rewarding the oil companies which are really doing some about climate change.
The bad news is that our model only works for Energy stocks. For other industries, the results are decidedly mixed. The return series we created, affectionally known as “XOP-SMOG ORTHO 1 BMG”, identified relatively few stocks in the other industries with statistically significant climate exposures. Other series we tried actually gave opposite answers. Depending on the ESG metrics, companies could have either positive or negative climate exposure. For example, take a look at Rio Tinto, a mining company with high climate risk exposure. Using two different ESG metrics, it could have either positive or negative climate risk exposure:
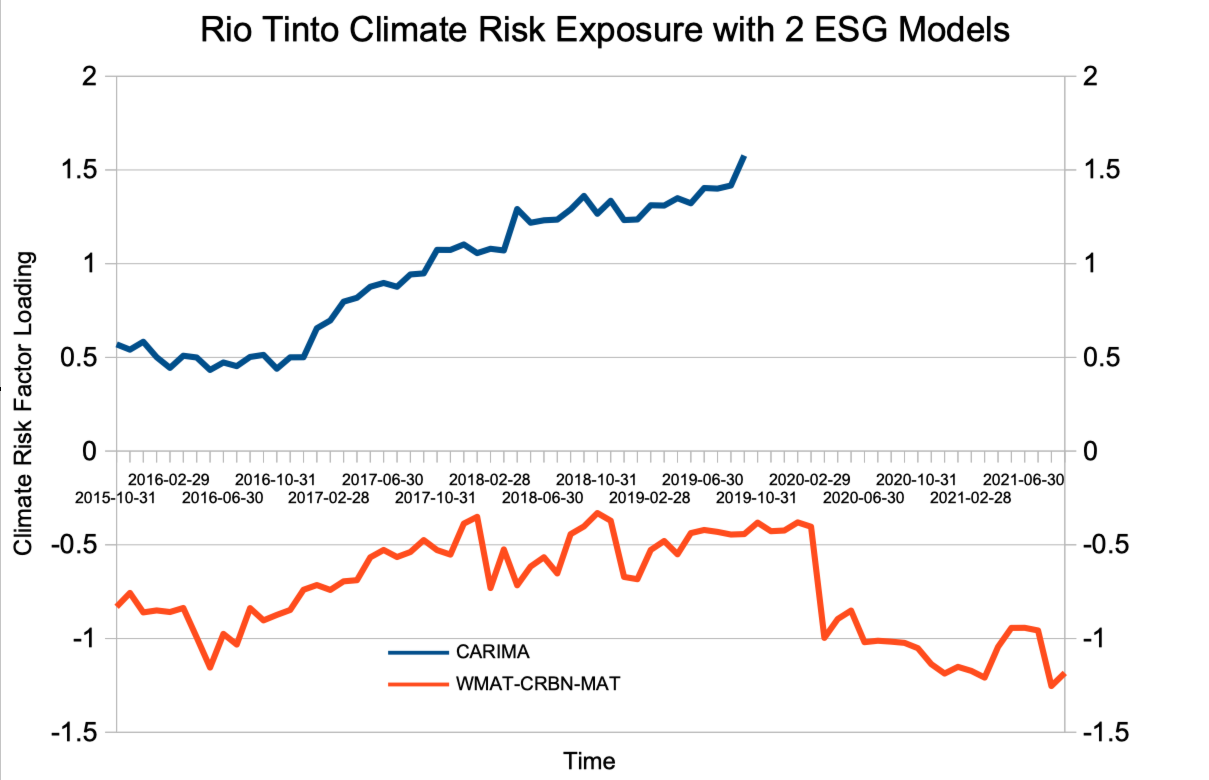
There are other examples like this. The important question is – Why does this happen? There are a few possibilities:
- The market isn’t pricing in climate risk in other industries, because it doesn’t know how climate change will affect those industries.
- The market doesn’t have a consistent climate risk gauge across industries, because each industry has a different mix of transition and physical risk.
- We haven’t found the right way to capture the market’s climate risk exposure in other industries.
The only way to find out which is the case is to try a lot more ways to identify Brown and Green stocks and then checking if they lead to results that make sense. Fortunately, our testing helped us find a process for doing exactly that:
- Check if the difference of the Brown and Green stocks’ returns, or BMG series, is correlated with other return factors from both the stock and bond markets
- If so, orthogonalize the BMG series by removing the effects of the other factors
- Calculate the factor loadings for each industry
- Calculate the factor loadings for all the stocks of a broad market index, such as the MSCI World index
- Compare the industries and stocks identified with significant climate exposure with fundamental resesarch about climate investment risks
Our next step is to scale this up: Streamline the steps. Test a lot more combinations of Brown and Green stocks. Create a model that will make climate investing actionable.
Stay tuned…